

 Current
location:
When tea polyphenol results differ between deliveries, check whether the numbers were produced from comparable samples and reported on the same basis before treating the change as a shift in leaf quality. Confirm the product identity, sampling record, method revision, and control status. Then decide whether the difference is likely to reflect the lot, a change in the preparation or measurement, or a difference in the way the result was calculated and reported.
Start with the question the result needs to answer
A receiving laboratory may be deciding whether to investigate a new delivery. A process laboratory may be asking whether two production runs are behaving differently. A quality manager reviewing a supplier performance chart may be comparing a season's worth of results. In all three situations, identify the specific group of samples that can reasonably be compared. The same units on a spreadsheet can conceal changes in tea type, sampling location or test procedure.
Review the lot description alongside the result. A delivery assembled from several production dates can show a different pattern from one originating in a single run. If there were changes in leaf grade, supplier, packaging, or storage before sampling, record them as possible explanatory factors. Keep the observations close to the measurements so the team can distinguish what it knows from what still requires investigation.
Check whether the test portions represent the same material
A container received by the laboratory can contain visible differences in the size of leaf pieces and fine material. Inspect the sampling record for the number and location of the increments used to create the laboratory sample. Check whether two values came from separate containers, separate laboratory samples, or test portions taken from the same prepared material. Each comparison captures a different level of variation.
For an internal investigation, trace both numbers back to the point where the samples diverged. Two readings from a single preparation help assess the reading step under the same conditions. Separate preparations from the same laboratory sample also include variation introduced by preparation. Independently collected samples from the lot include more of the variability associated with sampling. Set up the comparison to address the question under review, and label every result with the level at which the sample was repeated.
Reconcile dry matter and as-received reporting
Check the reporting basis whenever the sample moisture changed or when results came from different laboratories. Suppose both samples returned an as-received result of 12.0 grams per 100 grams. If one sample had 5 percent moisture, its equivalent dry-basis value would be about 12.63 grams per 100 grams of dry matter. At 9 percent moisture, the same as-received value corresponds to about 13.19 grams per 100 grams of dry matter. The difference in the calculated dry-basis results follows directly from the two moisture values.
Use the basis required by the procedure and the decision rule. Check that the moisture value belongs to the relevant sample and was recorded as a fraction or percentage consistently with the calculation. Compare the original result, moisture determination, and calculated result to spot transcription errors. Keep both the source value and its reported equivalent retrievable when your laboratory issues the converted number.
Review the test run before interpreting the lot
Look at the relevant controls, calibration records and sequence of samples. If results begin to change at the same point for multiple unrelated samples, investigate what happened around that point in the run. A change that follows a supply lot change, an interruption or a new preparation batch deserves a different review from an isolated result linked to one sample. Use the acceptance criteria established in the method to decide whether the entire run, a block of samples, or a single result needs further work.
Check any preparation, timing, or sample condition that the procedure identifies as significant. Colored or cloudy matrices can affect some optical methods. Follow the procedure's rules for sample eligibility and unusual appearances, and record anything that might help explain differences. Where the materials are difficult to compare visually, photographs or sample descriptions linked to the batch record can help a colleague understand why an investigation began.
Use repeat tests to narrow the cause
If controls were acceptable and a single sample has a surprising result, decide whether the next step should use the existing prepared portion, a fresh portion of the retained laboratory sample, or a new sample from the lot. Record why that material was chosen. Repeating only the reading may confirm an observation while leaving uncertainty about the way the portion was prepared. Repeating the sampling can address whether the retained laboratory material represented the lot but can introduce additional differences in collection and handling.
Retain the first result in the investigation record. Record the repeat result and the procedure used to decide which number can be issued. Avoid informal averaging of discrepant values unless the procedure defines that calculation and the conditions under which it applies. If a result sits close to a purchase specification, use the agreed decision rule and review procedure before communicating a pass or fail to the supplier.
Interpret process trends within comparable groups
Group charts by material and method when the laboratory handles several types of tea. A chart that pools results from different products can make normal differences look like analytical drift. Within one comparable group, review whether the shift is gradual, follows a specific supplier or batch, or affects everything tested within the same period. Include relevant control results when reviewing the chart so the laboratory can distinguish a sample trend from an analytical change.
Consider an internal receiving program that tests twenty deliveries during a period of several weeks. If three lower values come from a single supplier but the run controls remain within their established criteria, start by reviewing those deliveries and their sampling records. If lower values appear across suppliers immediately after a new preparation procedure starts, compare the previous and current procedures using agreed test materials before interpreting the change as a widespread shift in tea quality.
Close the investigation with a record that supports the next decision
Summarize the sample identities, relevant results, reporting bases, control status, and the evidence that connects the observed difference to a likely cause. Record which results can be used and what uncertainty remains. When an investigation finds that a worksheet encouraged inconsistent entries, update the worksheet and retain a clear effective date for the change. This makes later trend reviews easier to interpret.
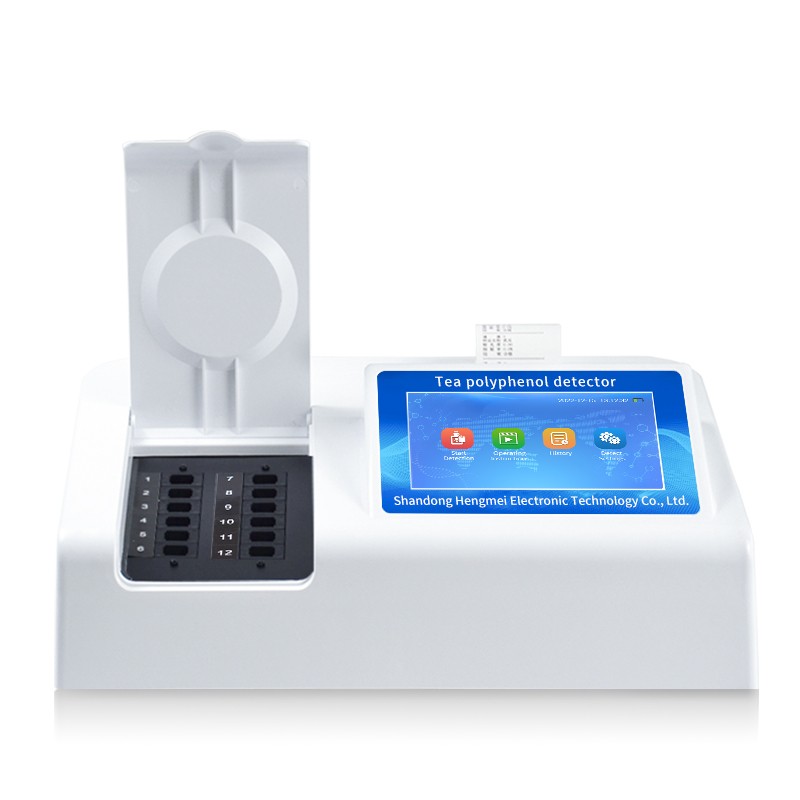
For teams using the HM-F12 tea polyphenol analyzer, keep the analyzer records linked to the preparation and sampling records that precede each reading. HENG MEI Intelligent Manufacturing is the brand of Shandong Hengmei Electronic Technology Co., Ltd. When discussing an unexpected result with technical support, share the sample type, procedure revision, reporting basis and control status. These details help focus the discussion on the specific stage that may account for the difference.
Align external and internal comparison samples
If an outside laboratory will help resolve the difference, agree on the identity, handling and reporting basis of the material before sending it. Give both laboratories test portions taken from the same suitably prepared material where the agreed procedure allows. Record the date and condition of each shipment. When results return, compare the method and units before calculating agreement, and keep the individual laboratory reports linked to the investigation.
Address of this article:https://www.hmfoodtesting.com/article/why-tea-polyphenol-results-differ-between-batches-heng-mei-intelligent-manufacturing.html
 Return to List